Uncharted Territory: Hacking Drug Shortages Through Persistent Invisible Physics
The economics of delayed quality decisions, and the antennas, pills, and experiments behind SignAiture.
Hours waiting for tests. Days investigating deviations. Batches worth $120,000–$3.6 million at stake in our customer-discovery synthesis. Original prototype and tablet-test images show why we pursued electromagnetic sensing.
The ambition behind SignAiture was to help manufacturers make reliable quality decisions earlier, so more medicine could reach patients without unnecessary delay. The technical question was simple to say: could we learn something useful about a material from how it responds to electromagnetic energy? The difficult part was deciding exactly what the response meant.
Our work moved through three instrument ranges: an early 2–6 GHz prototype, a 50–75 GHz horn-antenna setup with measurements shown around 50–67 GHz, and exploration across 200 GHz–2 THz. The samples, instruments, and questions evolved at each stage.
Below are the actual antenna fixture, tablet and contaminant photographs, and archived test curves, alongside the operating economics that made the problem worth pursuing.
Why release speed and quality belong together
Manufacturing a batch and being ready to release it are different milestones. If a quality decision depends on samples moving through a laboratory, waiting for results, or investigating an unexpected result, finished production can still be waiting for evidence. Finding a deviation earlier creates an opportunity to intervene before more material is affected. Finding it after distribution can mean a recall.
What we heard from manufacturing teams
Our customer-discovery work made the cost of waiting concrete. The May 2026 SignAiture deck synthesized more than 50 structured interviews with quality assurance, manufacturing science and technology, and operations teams. The priorities were fewer deviations, faster release, and less batch rework or loss.
The cost of a late answer
- Batch value range
- $120K–$3.6MBatch values recorded across the discovery cases.
- Batches affected
- 5–8%Failed or held—the combined category reported in discovery.
- Average investigation
- ~20 daysA deviation can take much longer to resolve than a laboratory test.
- Solvent test by GC
- 2–4 hoursTime for the existing gas-chromatography test, before the wider release workflow.
These numbers describe different parts of the same problem. A two-hour assay is only one step. Sampling, transport, queues, review, and a deviation investigation can keep a batch waiting much longer. Meanwhile, a small sample has to provide evidence about a much larger volume of material. That makes representative sampling, process understanding, and reliable measurements central to the decision.
Our problem slide framed batch-release holds at 7–14 days for the oral-solid-dose workflows we were targeting. I treat that as the deck's operating scenario, with actual timing dependent on the product and process. The opportunity was to move useful evidence closer to production: identify an abnormal condition earlier, establish a drying endpoint sooner, and give quality teams less uncertainty to resolve after the fact.
Quality failures become supply failures
The Government Accountability Office's April 2025 report makes the connection explicit. It cites FDA's finding that a majority of drugs entering shortage in a historical analysis followed manufacturing or product-quality disruptions. GAO also identifies a structural problem: manufacturers have too little economic incentive to invest in mature quality management.7
Quality reaches the patient through supply.
Manufacturing and product quality were the majority.
Of 163 drugs entering shortage in 2013–2017, 62% followed supply disruptions associated with manufacturing or product-quality problems.
FDA has separately identified outdated equipment, aging facilities operating at capacity, and ineffective quality management as contributors to shortages.8 That is the stronger version of the argument for modernizing quality systems: maintenance, process design, monitoring, and corrective action all affect whether production can keep running. Shortages most often affect sterile injectables; the broader evidence motivates the quality problem without proving the same cause mix for tablets.
Shortages. Recalls. Enforcement.
65% of studied recalls involved impurities, contaminants, or control issues.
These figures explain why the stakes extend beyond a factory's laboratory budget. Quality failures can take medicine out of circulation and disrupt supply. They also cover many failure modes; no single sensor addresses all of them.
A quality management system, or QMS, has to connect process knowledge, trustworthy records, monitoring, investigation, and corrective action. When those connections are weak, a measurement may arrive late, a deviation may recur, or a warning may fail to change the process. FDA's quality-management-maturity program makes the broader point: mature practices can reduce quality-related failures and improve supply reliability, beyond meeting minimum manufacturing requirements.6 A better sensor can contribute evidence to that system; it cannot substitute for the system.
This is where speed becomes meaningful. FDA's process analytical technology framework describes shorter production cycles, fewer rejects and reprocessing steps, and real-time release as potential benefits of better process understanding and in-process measurement.1 For a drying step, for example, the useful goal would be to establish that the material has reached a validated endpoint, then pass that evidence into the release decision. A faster scan alone does not establish that the batch is ready.
That was the opportunity I wanted to pursue: less time waiting for a trustworthy answer, and fewer quality problems discovered too late. The experiments below were early steps toward that goal. They did not yet demonstrate shorter batch-release times, fewer recalls, or a validated replacement for release testing.
The scale behind inside-each-pill analytics
The vision was to make each pill a verifiable data object: a physical unit connected to a measurement, its process context, and evidence about quality. The volume makes that an unusually demanding measurement problem—and a substantial opportunity if the measurement can earn its place on the line.
Trillions in use. Billions at one campus.
Quality evidence has to travel with production.
A global manufacturing footprint
60% India · 22% US
Shares of solid oral medicine volume produced for the US market in 2024, according to USP.12
Production across company boundaries
61% outsourced
Finished-dose production for therapies approved by FDA in 2024, in William Blair's analysis.13
For SignAiture, the attraction was the possibility of learning from repeated measurements in a real manufacturing process. A record becomes useful training evidence when it has reliable context and an independently established outcome. Billions of scans do not automatically become billions of quality labels.
From each pill to a usable quality record.
- 01MeasureCapture the physical response.
- 02ConnectAttach unit and process context.
- 03ValidatePair with trusted reference evidence.
- 04ImproveTest decisions on new batches.
Domino made marking the unit valuable.
Brother acquired Domino Printing Sciences for £1.048 billion. Its coding, marking, and digital-printing business shows the value that can be built around recurring production needs.14
The analogy that interested me was moving from putting information on a unit to learning something reliable about what is inside it. That is a product ambition; the acquisition price is not a valuation forecast for SignAiture.
The commercial test remains concrete: can earlier, trustworthy evidence reduce rework, improve a release decision, or keep a process within its quality limits? Scale makes the question important. It does not answer it.
The decision before the spectrum
An electromagnetic response depends on both material properties and the measurement arrangement. Composition, moisture, temperature, thickness, packing, geometry, alignment, and the fixture can all become part of what an instrument sees. A change in the trace is evidence that something in that system changed. Identifying what changed is a separate problem.
I was initially attracted to a broad possibility: signatures that could help assess identity, composition, or contamination. The more useful near-term question became narrower. Could a measurement support a specific process decision, such as whether drying had reached a defined endpoint?
The distinction matters commercially. An operator needs a reliable decision under representative conditions. A signal that responds to several variables might still be useful if those variables are controlled and its limits are understood. The same signal can be misleading if treated as a universal chemical fingerprint.
Stage one: the 2–6 GHz prototype
Zifu Wang contributed to the first prototype, the 2–6 GHz setup described here.
The early setup put the problem on a bench: antennas, a sample, and instrument traces. The photograph below is from the original 2024 presentation. It is useful context because the measurement arrangement is part of the experiment.
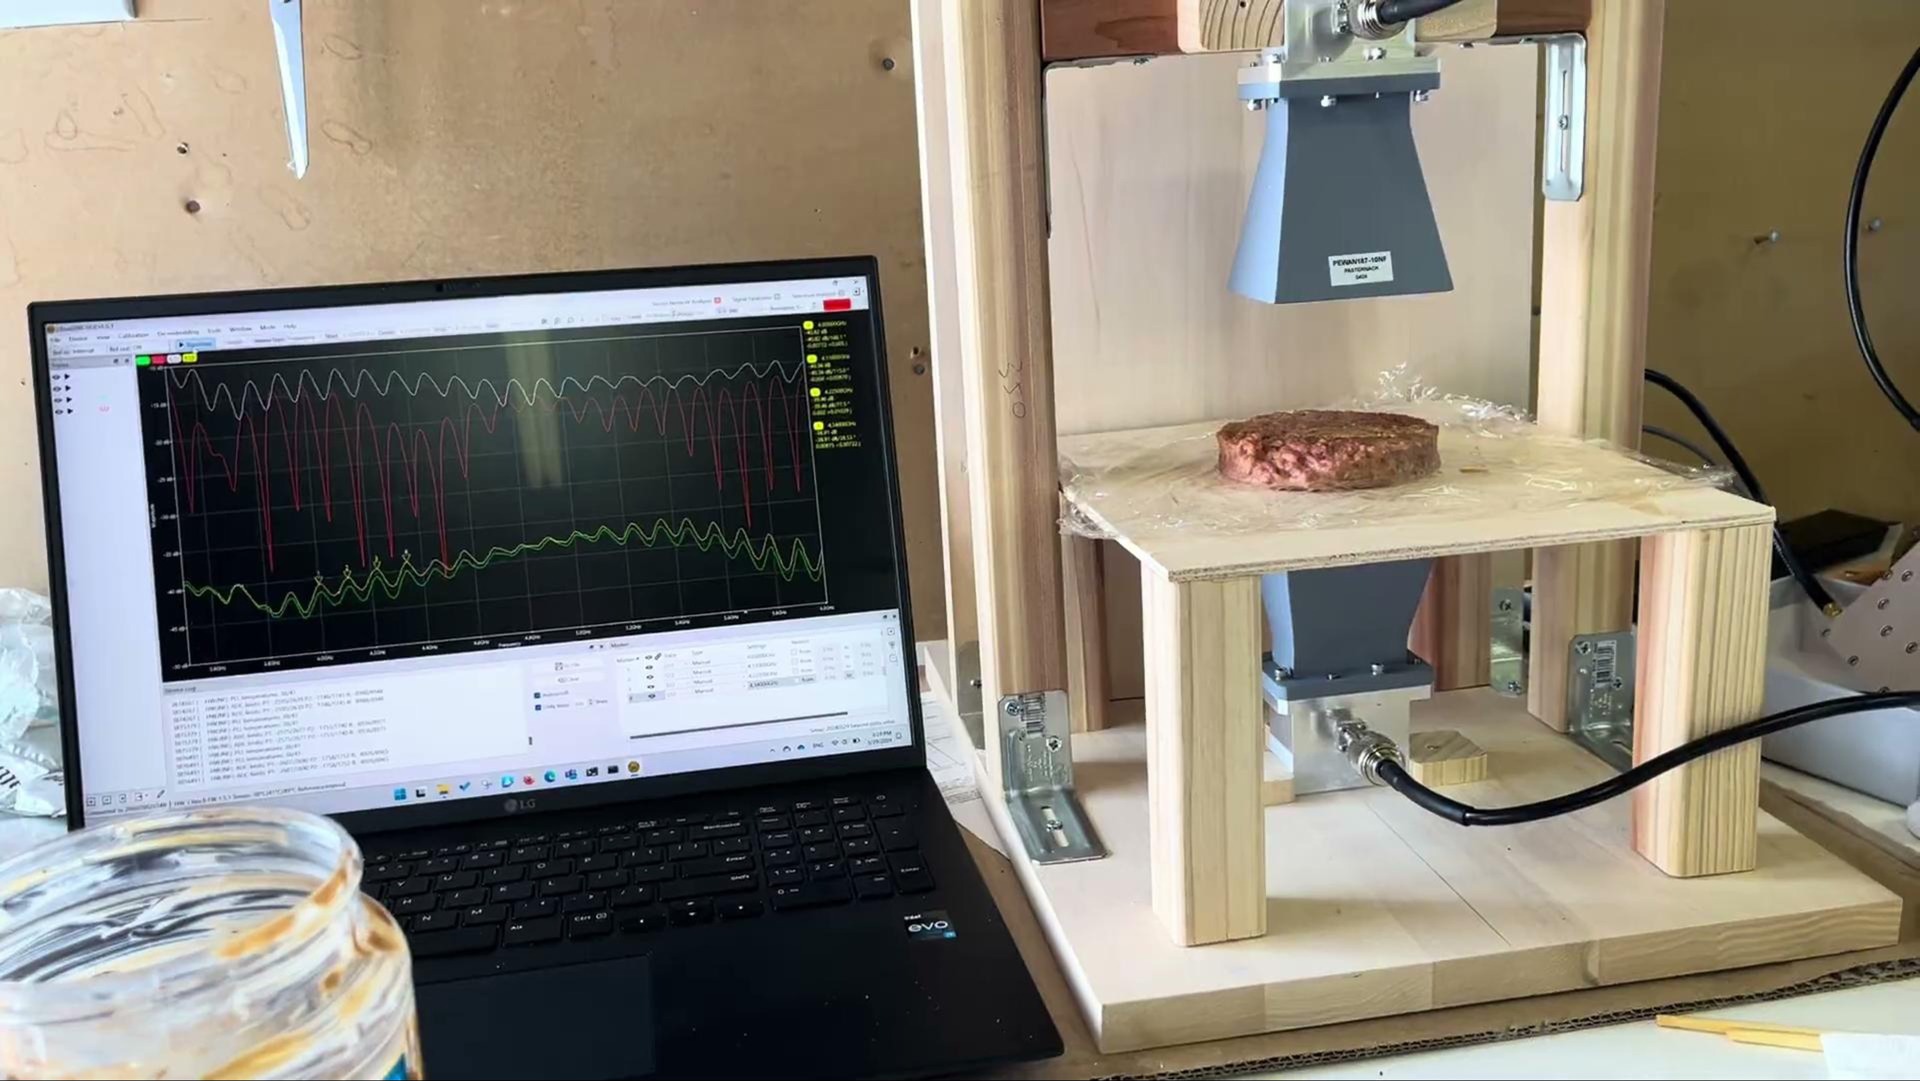
The accompanying comparison graphic explores changes in dimensions, nominal fat content, and aluminum debris. The reason to retain all three panels is that they show the central difficulty as well as the attraction: different kinds of change can alter a response.

What I take from this stage is a question about identifiability. If changing dimensions and changing composition both move the signal, what lets the system distinguish them in a new sample? More features may help, but more features do not remove the need for a controlled experiment.
I would retain the observation that the response is sensitive to the tested differences. I would not infer a concentration accuracy, a smallest detectable contaminant, or a transferable classifier from this graphic. The original underlying measurements and protocol would be needed for those claims.
Stage two: the 50–75 GHz antenna and tablet tests
Zifu Wang also contributed to the second prototype, which supported the millimeter-wave work in this section.
The photograph shows the actual 50–75 GHz horn-antenna setup: two opposing gold horns with the tablet holder between them. The hardware band and the plotted measurement span are different: the archived curves below run from roughly 50 to 67 GHz. Their numerical response axes are preserved as recorded; the source does not identify complete response units.
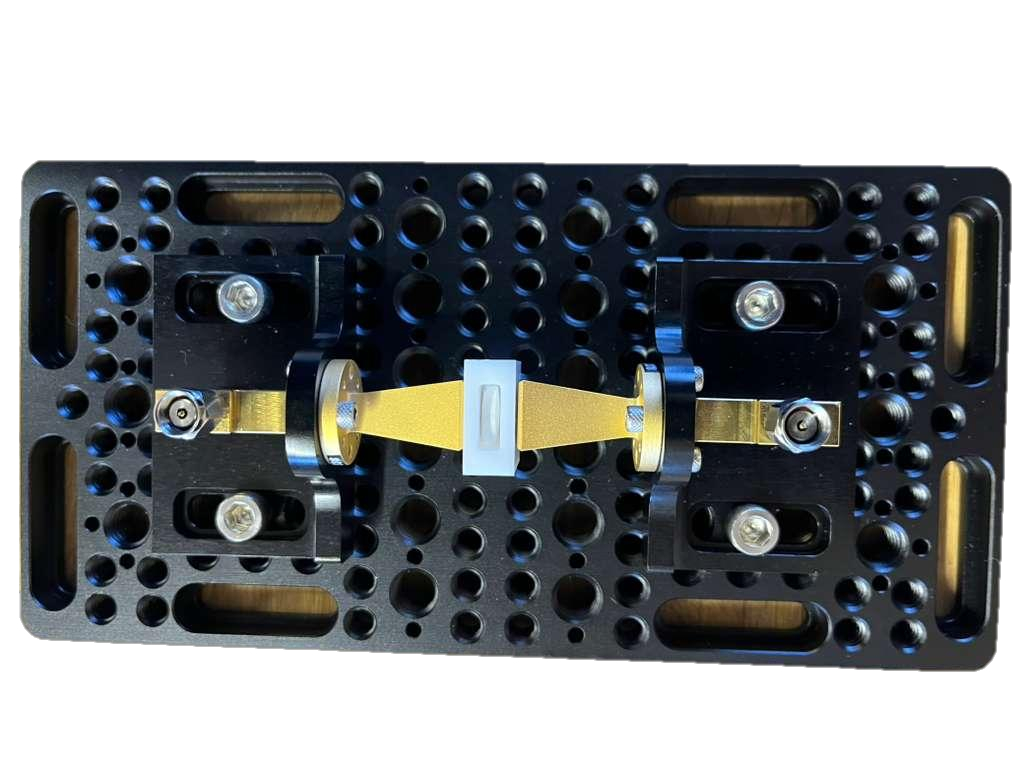
What we tested
The companion test overview records 226 tablets scanned. It covers active-ingredient variation, solvent and moisture effects, foreign material, and a repeatability and reproducibility exercise.
| Test | Experimental question | What the overview records |
|---|---|---|
| Active ingredient | Could different target levels separate in the response? | Two tablets per level; the displayed groups did not visibly separate. |
| Methanol drying | Would the response change as treated material dried? | A clear overall signature shift through the drying series. |
| Water drying | Would moisture changes appear in the response? | Strong changes, with a less clearly ordered drying pattern. |
| Foreign material | Would foil, plastic, or nitrile alter the signature? | Signature differences in the prepared comparison. |
| Repeatability and reproducibility | How stable was the measurement? | 90 measurements listed; the result was not included. |
Active-ingredient comparison
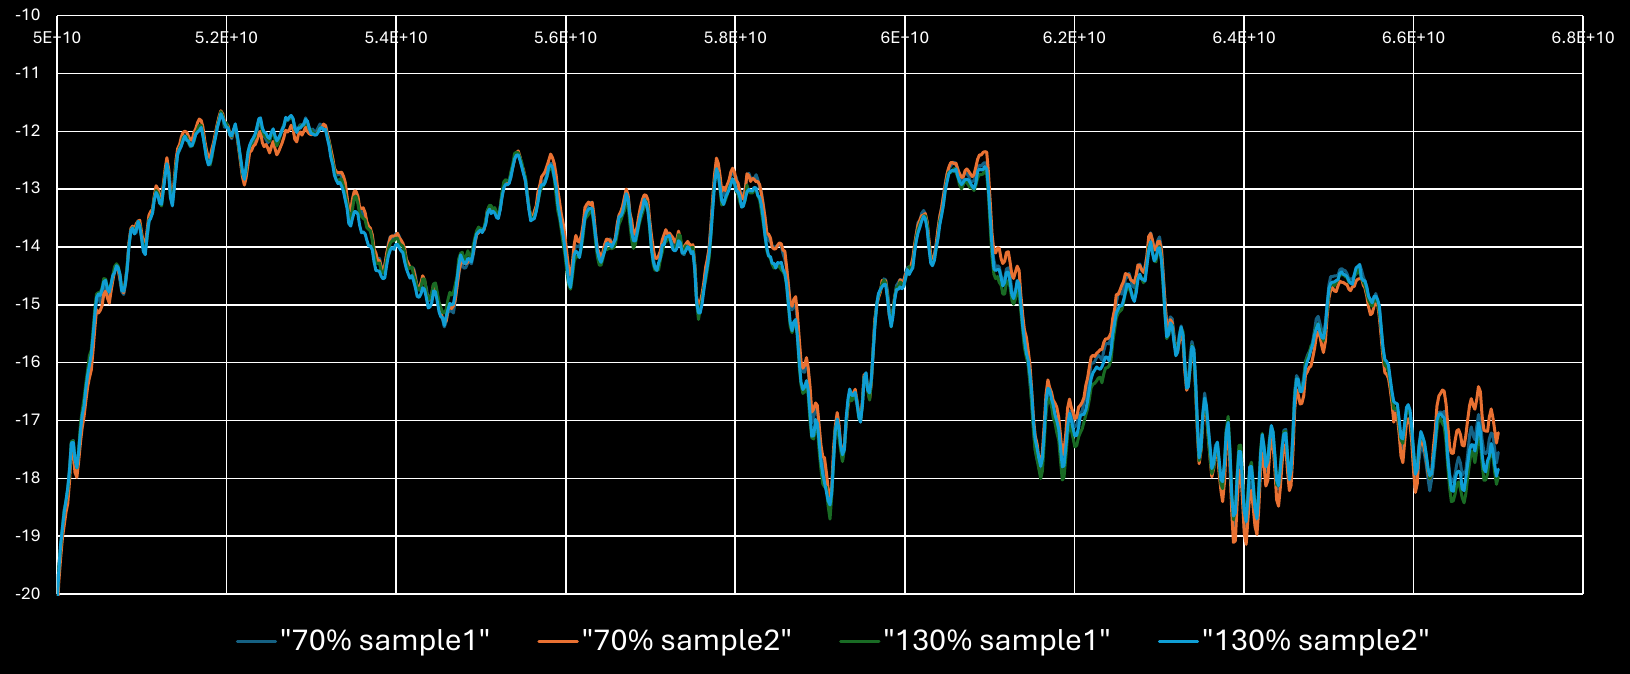
The active-ingredient comparison mattered because it showed the limits of simply looking at a trace. A useful response to drying or foreign material does not automatically become an assay for potency. Each question needs its own calibration and evaluation.
Methanol and water drying
For the methanol and water drying comparisons, the source slides describe two nominal-target tablets per experiment, soaked for fifteen minutes, then crushed, with drying at 60°C. These were deliberately modified samples: the drying experiments do not demonstrate non-destructive testing of intact tablets. The source's “100%-API” label refers to the nominal target, not independently verified chemical purity.
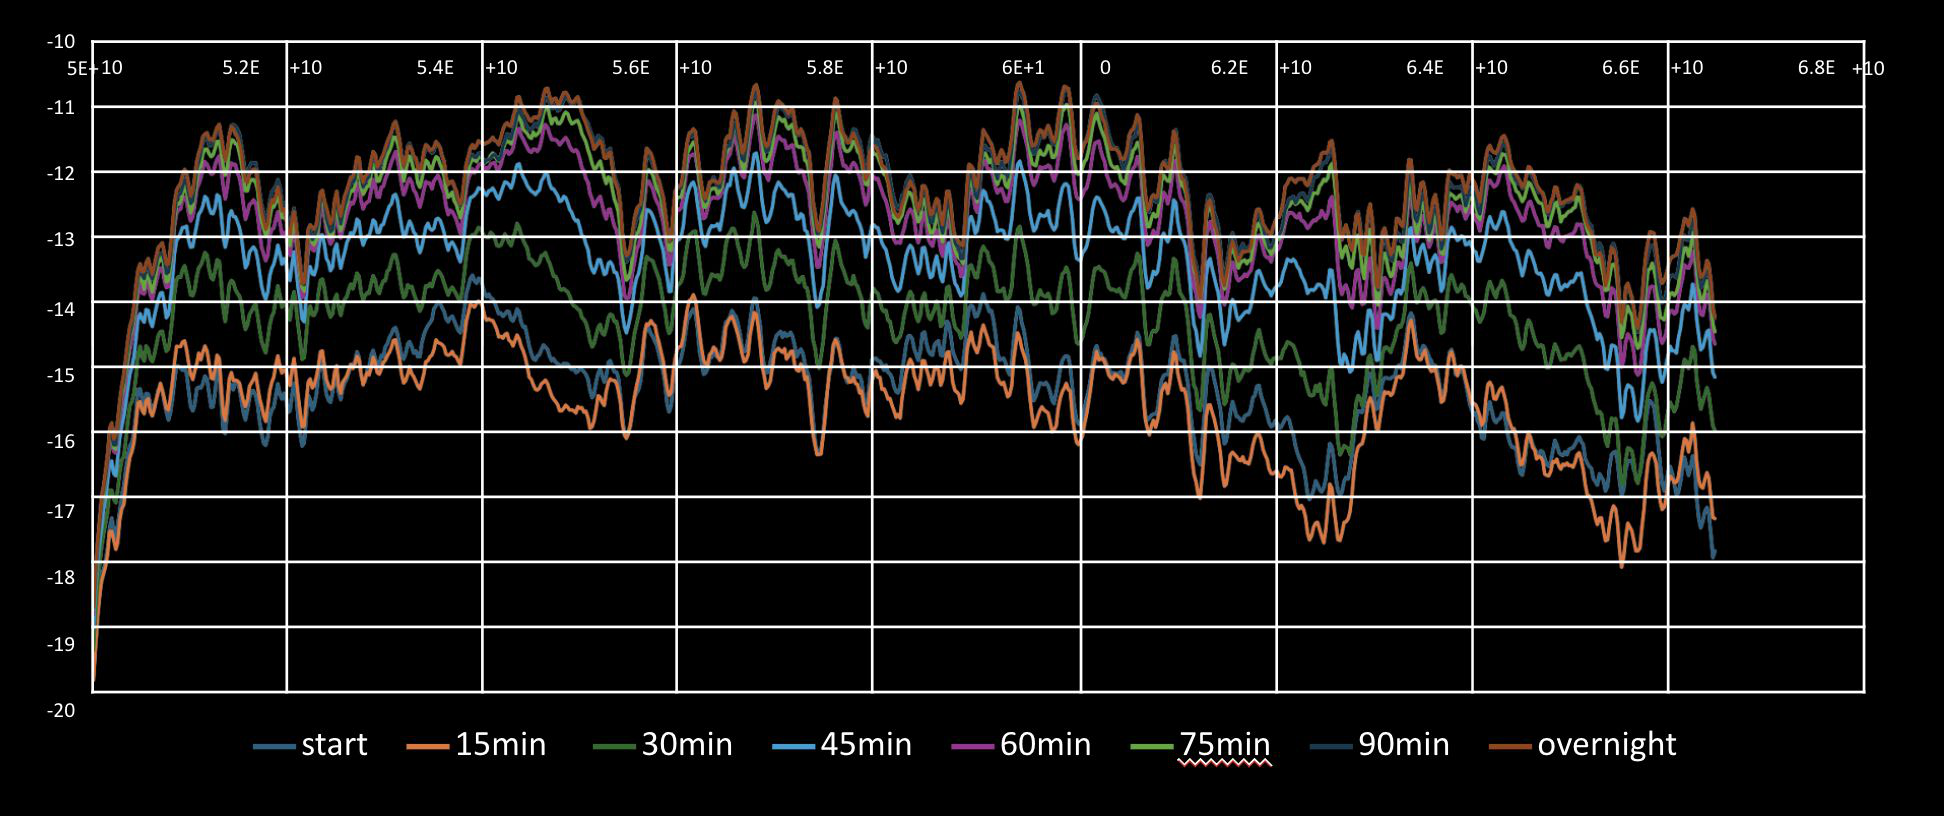
The methanol series is encouraging because response changes track the progression of the drying experiment. That is enough to motivate a paired measurement study. It is not enough to conclude that a particular trace equals a particular residual concentration, or that the correct stop time can already be read from it.
A drying experiment also changes time, temperature history, and possibly packing or sample state. Without reference measurements and controls, “the curve changed during drying” remains a weaker claim than “the instrument measured methanol.” That gap is where the next experiment belongs.
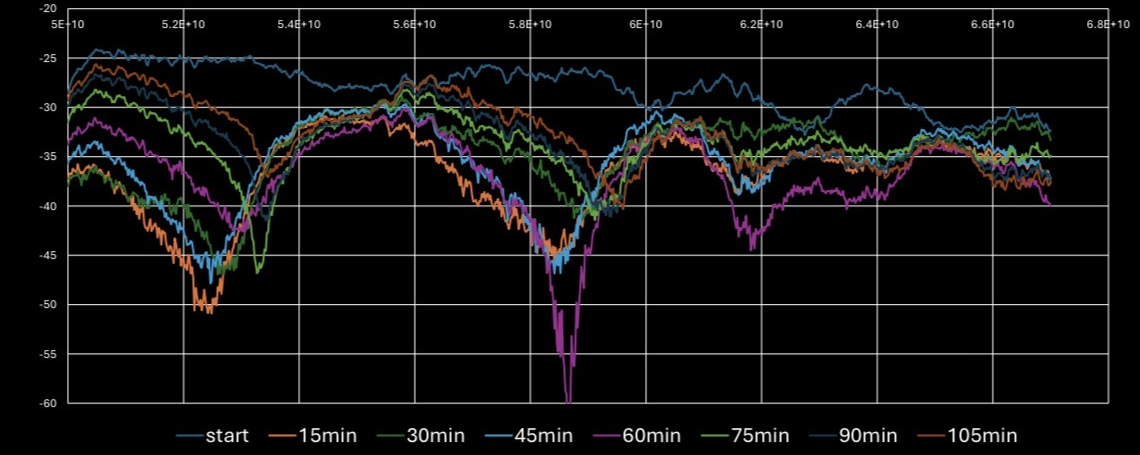
The water series is the figure I most want to keep in the essay. It resists a tidy sales story. Its behavior is less simply ordered over time, and the original slide itself asks about interaction with the tablet. That is a hypothesis, not an explanation the experiment has established.
I would explore at least four possibilities: an actual change in material state, changing moisture distribution, temperature dependence, and changes in packing or measurement geometry. The right answer may combine them. Repeating the experiment while changing one factor at a time would be more informative than choosing whichever part of the spectrum gives the neatest-looking correlation.
The contamination comparison
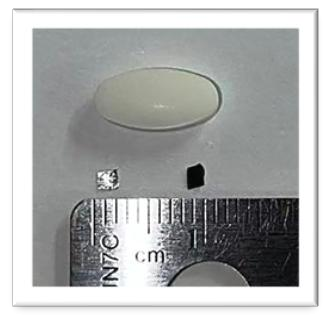
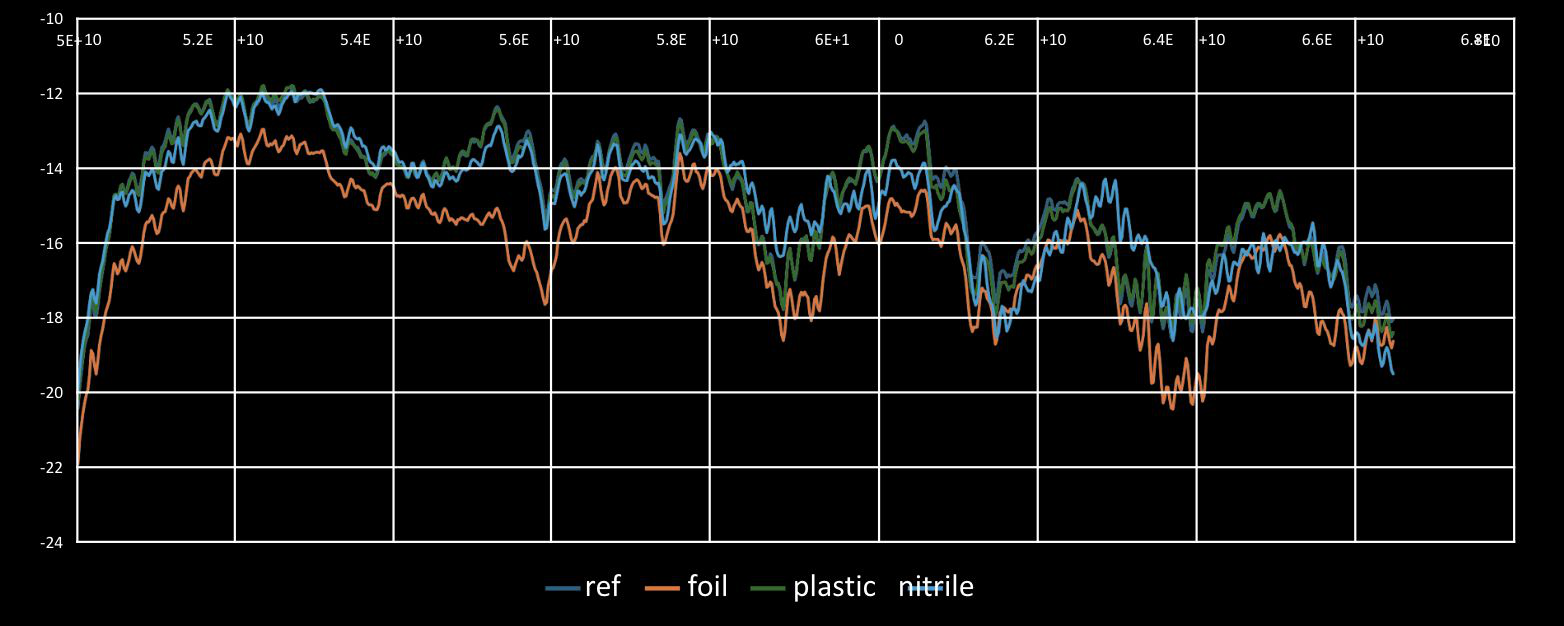
Foil is visibly different in this comparison. Some of the other traces are much closer. “Contamination changes the response” is therefore a more defensible description than claiming reliable detection of any contaminant.
The next question is whether those differences survive repeated preparation, different positions, new batches, and blinded labels. A classifier evaluated on repeated scans of the same prepared sample can look more capable than one evaluated on genuinely new samples. The split between training and testing has to respect how the material was prepared.
The June 2026 SignAiture application publication, naming Zifu Wang and me as inventors, records a broader product-quality architecture. Patent inventorship is a separate attribution from the prototype contributions described here; the disclosure does not make these figures a validation study.
Stage three: 200 GHz–2 THz
The terahertz exploration asked whether another spectral range would provide useful distinctions. The working range in my account is 200 GHz–2 THz, equivalently 0.2–2 THz. The archived figure itself displays an axis from zero to 2 THz.
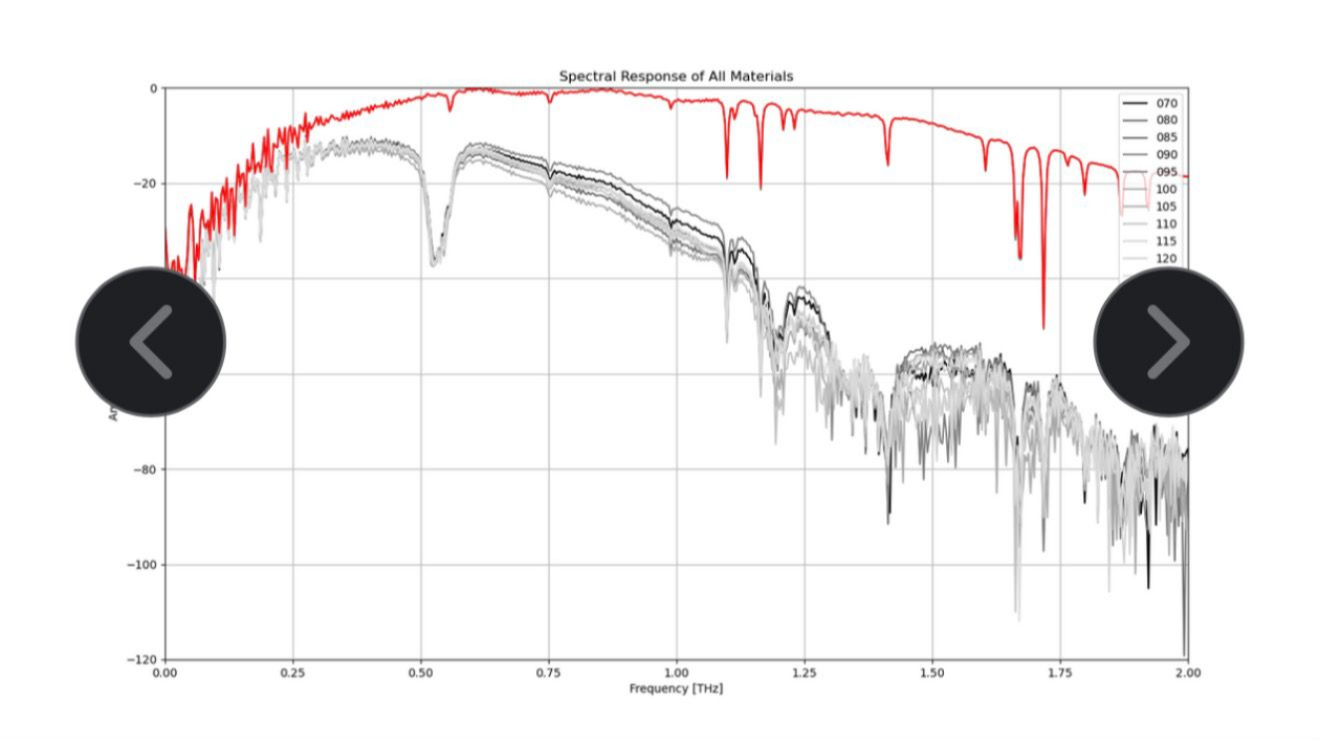
The curves show differences in amplitude, slope, and spectral features. They also become noisier toward parts of the upper range. The practical question is how much repeatable information remains above the usable noise floor, and which nuisance variables can reproduce the apparent distinctions.
The screenshot alone cannot establish API quantification accuracy. It does not provide a complete mapping from labels to independently assayed composition, replicate counts, or held-out predictions. Nor should every dip be assigned to a molecule from its appearance. Reference, environmental, and sample measurements would be needed to interpret the features.
Moving upward in frequency was an exploration of information, not proof that the highest-frequency instrument wins. The best commercial instrument may use a narrower band if that band supports the decision with a simpler, cheaper, more stable deployment.
What changed in my thinking
| Starting attraction | What the evidence pushed me to ask |
|---|---|
| A distinctive curve could identify a material | Can different causes produce the same apparent distinction? |
| More bandwidth should reveal more | Which parts of the band contain repeatable, decision-relevant information? |
| A drying response could identify an endpoint | Does it agree with a defined reference endpoint on new batches? |
| A contamination example could become a detector | What are the false-positive and false-negative rates under representative variation? |
| A model could find the signal | Does the model generalize beyond sample preparation, fixture, and batch? |
The narrowing is progress. A validated process measurement can be valuable without becoming a universal scanner. The FDA’s process-analytical framework centers process understanding rather than the novelty of a sensor. That is a useful discipline for deciding what the instrument should do next.
The next experiments I would fund
First, recover the instrument exports and calibration records. A presentation image is not a data package. We need the measured quantity, acquisition settings, reference and blank scans, environmental conditions, sample preparation, and a reliable mapping between each trace and its sample.
Second, vary the confounders deliberately. Cross moisture or solvent levels with temperature, packing, thickness, and formulation. Include blanks, repositioning, different days, and independently prepared samples. The experiment should give the preferred explanation a real chance to fail.
Third, pair each sample with a reference appropriate to the decision. Water, residual solvent, and active-ingredient concentration are different analytical questions. NIR or Raman may be useful comparisons or complementary measurements, but neither is automatically ground truth for every target. FDA’s NIR guidance is a reminder that calibration and validation remain substantive work even for an established modality.2
Fourth, lock the model and decision threshold before testing genuinely held-out batches. Report uncertainty, false alarms, missed events, drift, and conditions under which the instrument refuses to answer. Compare the result with the current process at the same quality standard, including the cost of errors.
Finally, test the deployment. A useful laboratory relationship can fail at the window, in changing geometry, during cleaning, or in the handoff to the operator. The cost of calibration and support belongs in the result.
The question I want these experiments to answer is specific: can a bounded measurement improve a real decision enough to justify its place in the workflow? The existing figures earned that question. The next work has to earn the answer.
Figure provenance
Figures 1–2 come from the 2024 SignAiture presentation. Figures 3 and 7 are original embedded photographs from the sample-test overview, pp. 2 and 6; figure 4 is rendered directly from its original chart on p. 3. Figures 5 and 8 are embedded chart images from the later two-minute presentation; figure 6 is cropped from the archived drying-test slides; figure 9 is an archived THz screenshot. The test overview also supplies the scan count and test descriptions. The operating figures come from the May 2026 SignAiture deck, pp. 5 and 10. Customer names, logos, product identifiers, and exact formulation details are omitted. The photographs and curves have not been generatively altered; display files exclude private metadata. No values, error bars, or missing curves have been generated.
Updated 2 November 2026: added the GAO quality-and-shortage evidence, sourced industry visuals, manufacturing scale, and the unit-level data vision. Forecasts, historical cohorts, and illustrative record volumes are labeled separately. This edition also includes the 50–75 GHz antenna fixture, tablet-test photograph, active-ingredient comparison, and customer-discovery economics. Zifu Wang's prototype credits apply to stages one and two.
Sources & notes
- FDA · Process Analytical Technology framework ↗
The process-understanding and measurement framework. It does not validate the experiments reproduced here or authorize a specific quality-release decision.
↩ Return to text - FDA · Development and Submission of Near Infrared Analytical Procedures ↗
A reference for disciplined calibration and validation of NIR procedures. NIR is a possible comparator for some questions, not a universal ground truth for every RF or THz measurement.
↩ Return to text - FDA · Drug Shortages Root Causes and Potential Solutions ↗
2019 report, updated February 2020, p. 33. Of 163 drugs entering shortage in 2013–2017, 62% followed supply disruptions associated with manufacturing or product quality problems. This is a historical cohort, not a current share of all shortages.
↩ Return to text - Ghijs et al. · The continuing challenge of drug recalls ↗
Journal of Pharmaceutical and Biomedical Analysis, 249 (2024), 116349. The authors report an annual average of 330 recalls in FDA data from 2012–2023; 37% involved impurities or contaminants and 28% control issues. These categories cover failures far beyond the experiments described here.
↩ Return to text - FDA · Report on the State of Pharmaceutical Quality FY2024 ↗
Printed p. 17: 105 quality-related warning letters to human drug manufacturing sites in FY2024. The increase was largely associated with inspection-based letters and increased inspections; the count alone does not establish worsening quality.
↩ Return to text - FDA · Quality Management Maturity ↗
FDA links mature quality management to fewer quality-related failures and more reliable supply. The program encourages practices beyond minimum CGMP requirements.
↩ Return to text - GAO · Drug Shortages: HHS Should Implement a Mechanism to Coordinate Its Activities ↗
April 2025, GAO-25-107110. Cites FDA’s historical 62% finding and identifies inadequate incentives to invest in mature quality management. Shortages most commonly affect sterile injectables; the finding is not an oral-solid-dose-specific estimate.
↩ Return to text - FDA · Pharmaceutical Quality Oversight ↗
White paper identifying outdated equipment, aging facilities operating at capacity, and ineffective quality management as contributors to drug shortages. These system-level problems extend beyond any single measurement technology.
↩ Return to text - IQVIA · The Global Use of Medicines 2024 outlook ↗
January 2024 forecast: annual global medicine use reaching 3.8 trillion defined daily doses in 2028. Defined daily doses are a standardized use measure, not a count of physical pills or doses produced each day.
↩ Return to text - AstraZeneca · Södertälje campus ↗
AstraZeneca reports 11–12 billion tablets and capsules produced annually at its Södertälje campus. This is a physical unit count, unlike IQVIA’s defined-daily-dose measure; it does not indicate a SignAiture deployment.
↩ Return to text - ASHP / University of Utah · National Drug Shortages ↗
Report through September 30, 2026: 323 active shortages at the Q1 2024 peak and 225 at the end of Q3 2026. Active shortages are a point-in-time count, not the number of new shortages per year. ASHP and FDA use different shortage definitions.
↩ Return to text - USP · Senate testimony on drug supply-chain resilience ↗
September 17, 2025 testimony, p. 6: India produced 60% and the United States 22% of solid oral medicine volume serving the US market in 2024. These are production shares for US-market supply, not global pharmaceutical production or spending.
↩ Return to text - William Blair · Updating FDA Approval Analysis for 2024 Data ↗
The analyst’s approval-cohort analysis reports outsourced finished-dose production for 61% of therapies approved by FDA in 2024. This is not an estimate for all branded drugs or for clinical-research outsourcing.
↩ Return to text - Brother · Acquisition of Domino Printing Sciences ↗
August 2015 investor presentation, p. 4: total acquisition price of £1.048 billion. Domino supplied coding, marking, and digital printing equipment. This is a historical industrial-infrastructure analogy, not a valuation estimate for SignAiture.
↩ Return to text
Notebook · Published 2026-11-02
Editorial method & provenance
Responses & questions.
What am I missing? Share a correction, counterargument, or relevant experience.
Loading responses…
Add a public comment
Send me a private note about this article
About: Uncharted Territory: Hacking Drug Shortages Through Persistent Invisible Physics